Analysing the Results
Results Spreadsheets
The Results_Summary spreadsheet provides a comprehensive breakdown of the simulation results:
Size of Grid Components: This section includes the installed capacity of each grid component. In case of capacity expansion, it shows the size of each component after every investment step.
Project Cost: The economic breakdown of the system’s costs. All costs are actualized to the year at which they occur.
Yearly Cash Flows: This section offers a detailed breakdown of yearly non-actualized costs, including fixed O&M, fuel costs, battery replacements, and lost load. Costs are grouped by component type, such as batteries, generators, and renewable technologies.
Yearly Energy Parameters: This subsection contains the following parameters:
Generators Share: The total energy provided by generators divided by total electric demand.
Renewables Penetration: The total energy provided by renewables divided by the sum of total energy provided by both renewables and generators.
Curtailment Share: The total energy curtailed divided by the sum of total energy provided by both renewables and generators.
Battery Usage: The total energy discharged by the batteries divided by total electric demand.
Grid Usage: The total energy withdrawn from the national grid divided by total electric demand.
Yearly Energy Parameters SC: This subsection provides the same parameters as above, but for each scenario.

The Time_Series spreadsheet contains hourly data of the system’s energy balance, including technology energy production, battery energy flows, demand, lost load, and curtailment. Additionally, it tracks the state of charge of the batteries and the fuel consumed by the generators. Each year of the time horizon is reported on a different sheet.

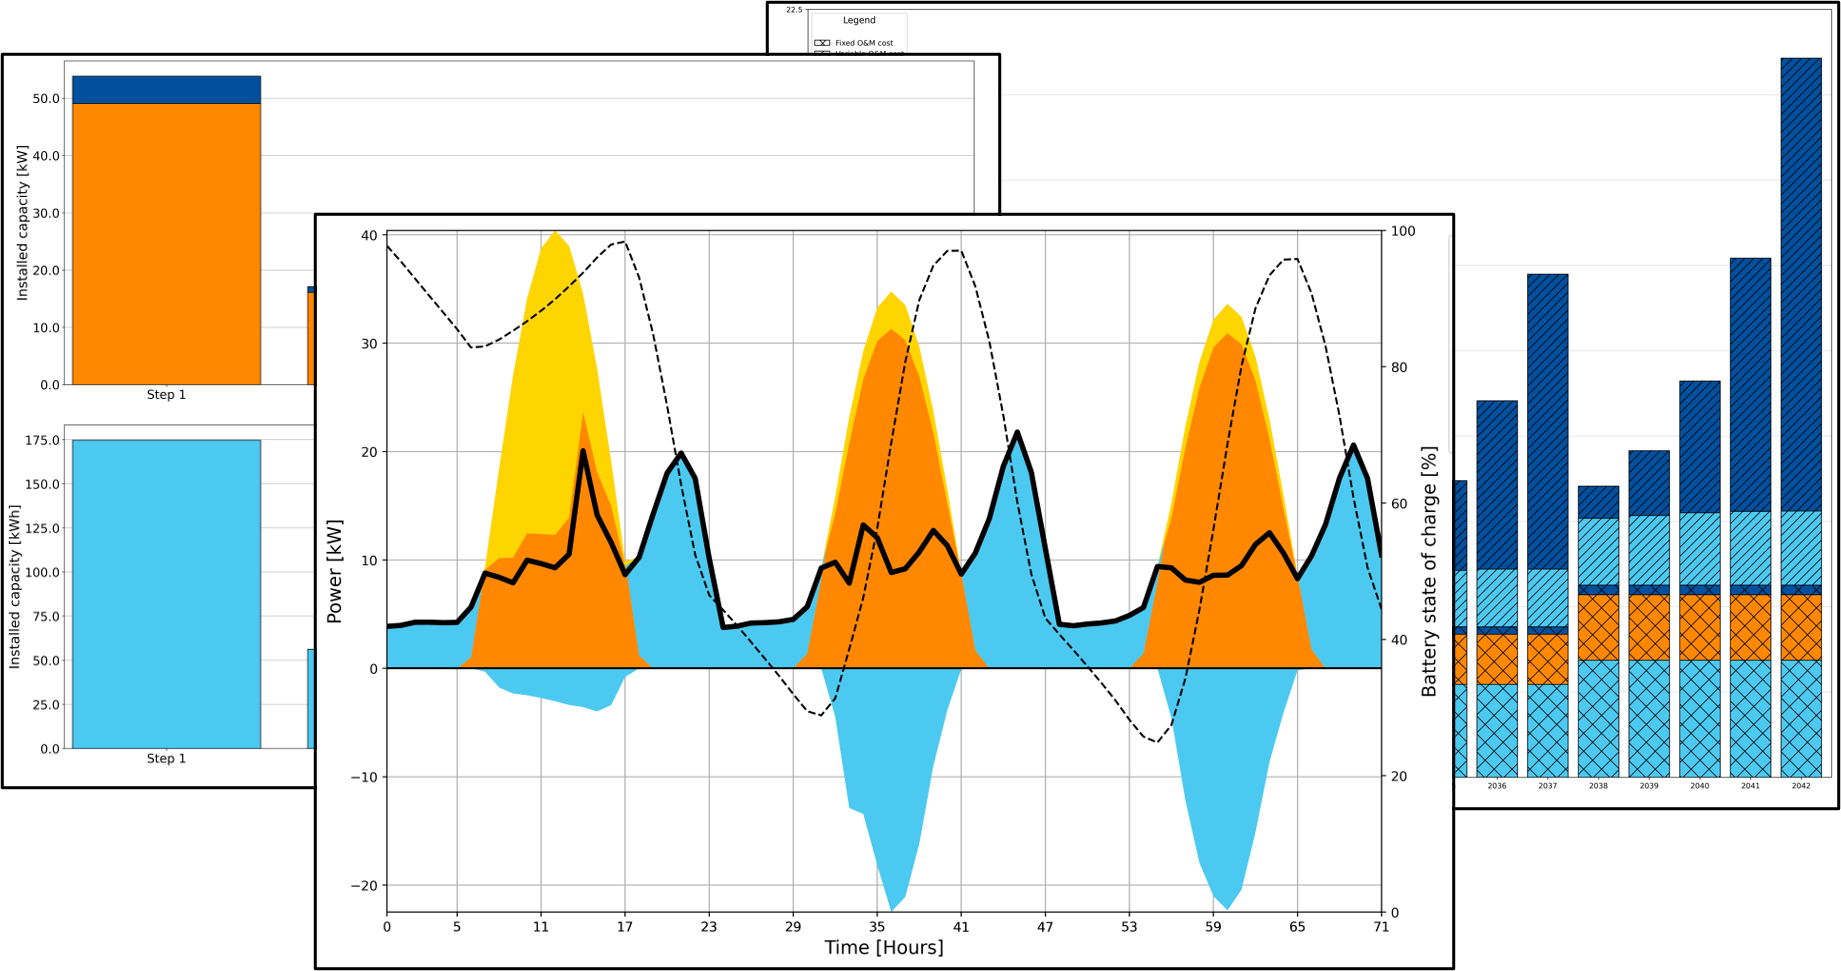
Plots
The Plots offer graphical representations of the simulation results:
DispatchPlot: This plot provides insights into the dispatch strategy of the energy resources within the system. It illustrates how different energy sources are utilized over time to meet the energy demand, aiding in understanding operational dynamics.
Size Plot: This plot visually conveys information about the sizing of components within the system. It helps users assess the capacity and scale of various elements, facilitating an evaluation of component sizes for the given energy scenario.
Cost Plot: This plot displays information on the costs associated with energy production, storage, and other operational expenses. Cost plots are crucial for economic evaluations and decision-making within the energy system.