#################################
Example Gallery
#################################
Case Study
-------------
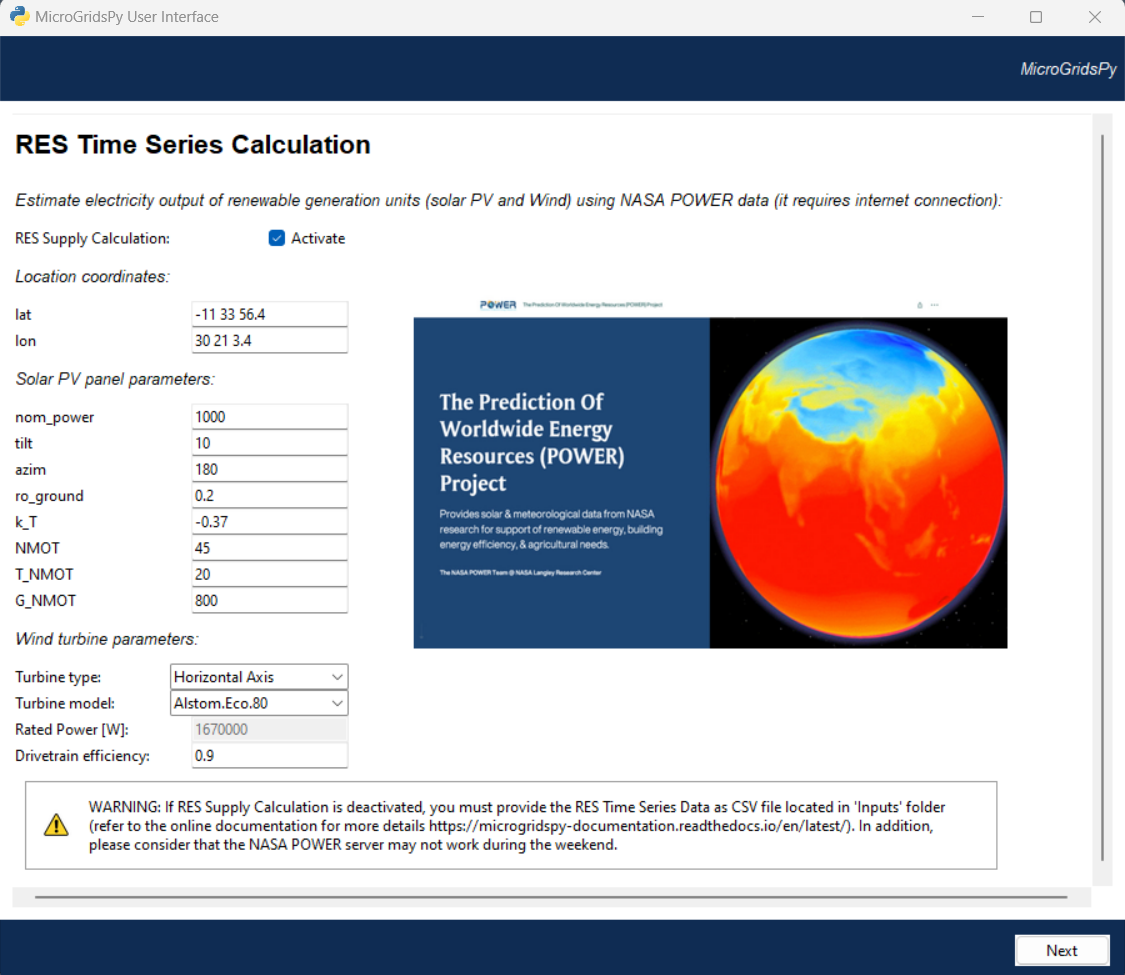
In this exemplative case study, the focus is on a rural village situated in the Sub-Saharan region of Africa, precisely in Bangweulu Wetlands, Zambia.
This location benefits from a solar-rich environment typical of the Sub-Saharan climate, making it an ideal candidate for photovoltaic (PV) systems. With a nominal power capacity of 1000 kW, the PV installation is optimized with a tilt angle of 10 degrees to harness the high solar potential and an azimuth of 180 degrees for optimal sun tracking throughout the year.
.. figure:: https://github.com/SESAM-Polimi/MicroGridsPy-SESAM/blob/MicroGridsPy-2.1/docs/source/Images/case%20study.png?raw=true
:width: 700
:align: center
Global Solar Atlas - Bangweulu Wetlands, Zambia.
The chosen site's geographic and climatic conditions are favorable for renewable energy projects, with abundant sunlight and moderate albedo effects contributing to the efficiency of solar power generation.
The specified tilt and azimuth angles are particularly well-suited to the region’s latitude, ensuring that the solar panels receive maximum irradiance during peak sun hours.
The RES time series are generated endogenously using NASA POWER data ad well as the load curve demand starting from the built-in archetypes.
Default Scenario
----------------
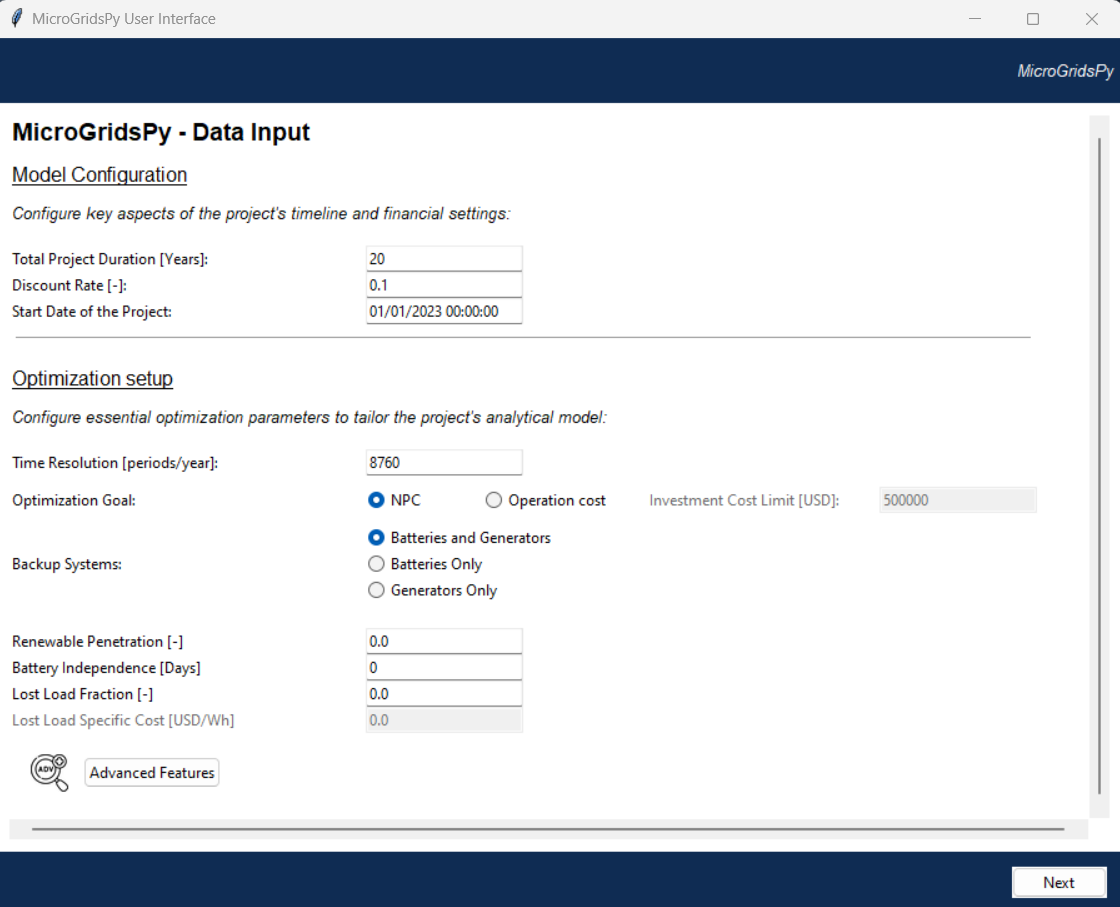
In this basic example run of MicroGridsPy, we demonstrate the foundational capabilities of the tool for microgrids simulation and optimization. The basic configuration for this run is as follows:
- **Time Horizon**: 20 years
- **Renewable Energy Sources (RES)**: Photovoltaic (PV) and Wind Turbine systems available.
- **Formulation**: Linear Programming (LP)
- **Optimization Goal**: Net Present Cost (NPC)
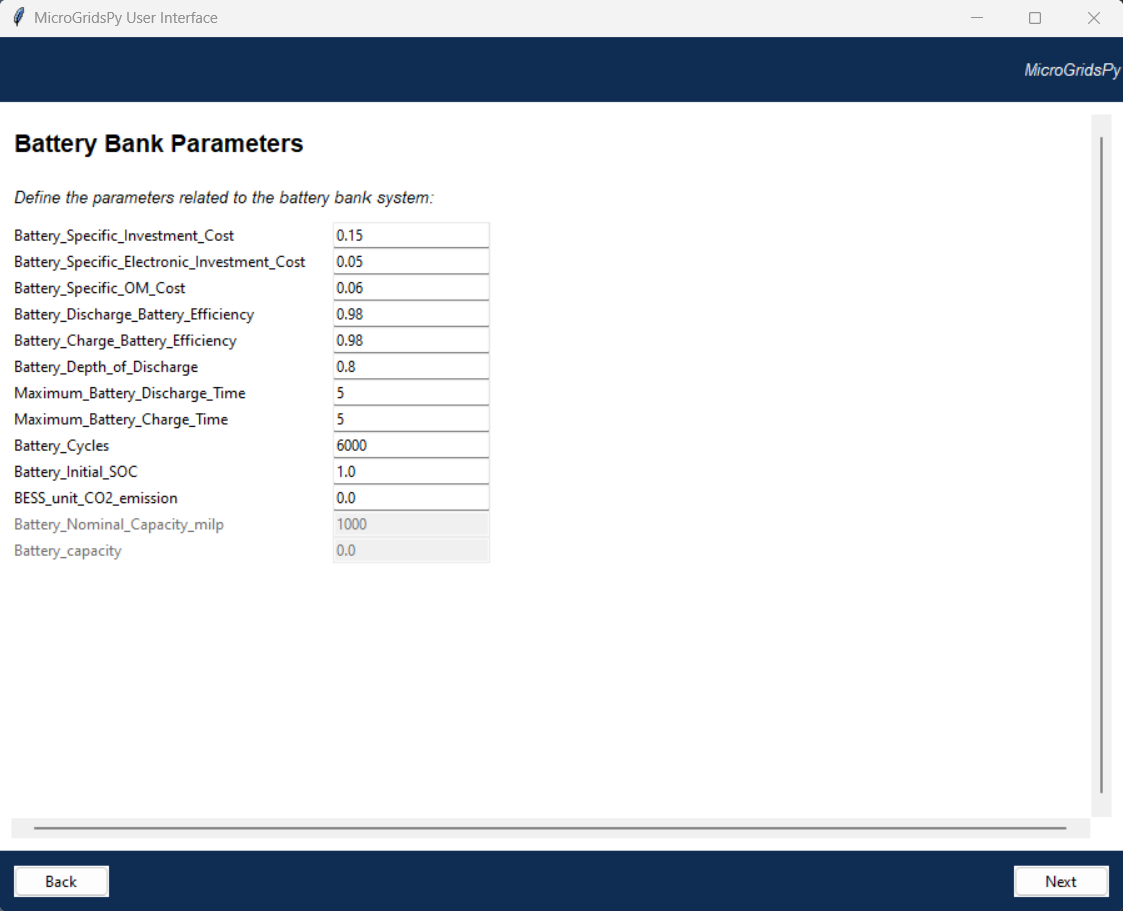
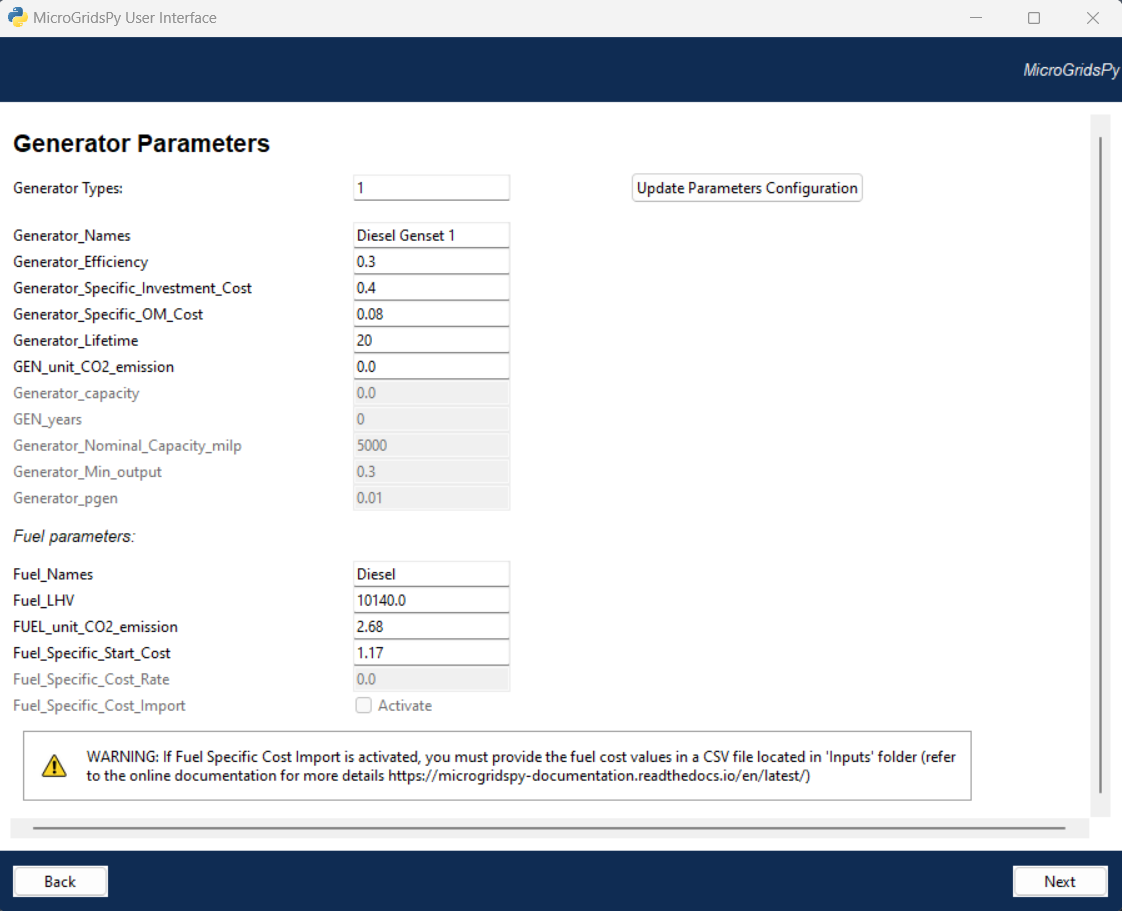
- **Backup Systems**: Both battery storage and diesel generators included.
- **Extra Features**: No extra features or advanced models activated.
The images gallery below visualizes the interface windows, simulation outcomes, displaying the dispatch strategy, and other critical metrics.
.. raw:: html
-------------------------------------------------------------------------------------------------------------
**Results Interpretation**
In the default scenario, the energy composition is substantially influenced by renewable sources but with the evident absence of Wind Turibine which has been proven to be not convenient in this specific scenario, resulting in a renewable penetration rate of 77.38%. This approach is bolstered by a 34.87% utilization of battery storage, which plays a critical role in energy continuity.
Despite the emphasis on renewables, diesel generators contribute a notable 23.13% to the energy provision. This contribution is particularly significant given that it addresses supply shortfalls when renewable generation and battery storage do not fully meet the demand.
Reguarding costs, Net Present Cost (NPC) is equal to about 132 kUSD while LCOE (representing an ideal and simplified tariff for the users) is 0.2562 USD/kWh.
The financial trajectory, as depicted in the Cash Flow Plot, suggests a gradual uptick in diesel generator reliance. This pattern underscores the need for expanded generation capacity to accommodate the ascending energy demand. However, such reliance on diesel generation is not statically doomed to increase unchecked. The model is equipped to simulate escalating fuel costs annually, providing an economic counterbalance to generator dependence. By incorporating the reality of rising fuel costs, the model adds an economic impetus for investing in more renewable sources and storage solutions over time.
The following simulations will include the integration of capacity expansion strategies, refined modeling of generator operations to include partial load effects, and a transition to WACC for a more detailed financial outlook. Moreover, with the capacity to simulate incremental fuel costs, the model will offer insights into how escalating operational expenses might naturally curtail reliance on fossil-fuel generators, thus reinforcing the economic viability of renewable solutions.
Capacity Expansion and Increasing Fuel Cost
---------------------------------------------
This new simulation is designed to reflect the dynamic nature of energy needs in rural communities and the economic pressures that come with fuel-based generation.
By introducing capacity expansion every five years and modeling a 5% annual increase in fuel cost, the aim is to capture the potential shifts in technology usage and financial metrics, thereby providing a more realistic depiction of a mini-grid's performance over time.
For the sake of semplicity, Wind Turbine has been removed from the available renewable technologies.
.. raw:: html
-----------------------------------------------
**Result Interpretaion**
Notably, there is an increase in average renewable penetration per year, which has risen to an impressive 96.37%. This suggests that the capacity expansion allowed every five years is effectively mitigating the increased demand, allowing renewables to maintain a dominant role in the energy mix.
The battery bank's average usage per year has also seen a significant uptick to 50.83%, likely due to the expanded capacity that supports higher levels of storage and dispatchability to manage the variability of renewable sources. This is a substantial improvement from the 34.87% utilization in the default scenario, highlighting the benefits of aligning storage capabilities with generation capacity.
Diesel generator usage has dramatically decreased to a mere 4.04% share per year, down from 23.13% in the default model. This can be attributed to the dual strategy of expanding renewable capacity and the deterrent effect of the rising fuel costs, which make diesel generation less economically attractive.
One of the most critical financial indicators, the Levelized Cost of Electricity (LCOE), has decreased from 0.2562 to 0.2376 USD/kWh. This reduction suggests that the increased investment in renewable capacity and the strategic use of battery storage are yielding a more cost-effective energy production mix over time, despite the initial higher investment costs and the increasing fuel costs.
Curtailment has also increased to 11.24%, up from 4.83% in the default model. This is an expected outcome in systems with significant renewable energy penetration, where excess generation capacity is installed to ensure reliability. However, this also indicates that there is room for optimization, possibly through better demand-side management or further technological enhancements.
Capacity Expansion and Grid Connection
-----------------------------------------
This new simulation is designed to test the on-grid model, setting the grid connection starting from year 10, and compare it with the previous scenarios.
.. raw:: html
-----------------------------------------------
**Result Interpretation**
The average renewable penetration per year is now at 78.72%, allowing for strong reliance on grid power (as it is clear also from the plots), reducing the overall proportion of energy sourced from renewables in the mini-grid system.
Battery usage per year has decreased to 35.26% from the previous 50.83%. This reduction indicates that the connection to the main grid provides an alternate source of energy during periods when renewable generation is insufficient, thereby reducing the reliance on battery storage.
The diesel generator share per year has decreased further to 3.78%, a slight reduction from the already low 4.04%. This reduction reinforces the trend of moving away from fossil fuel-based generation in favor of cleaner energy sources and the support of grid power.
The Levelized Cost of Electricity (LCOE) stands at 0.2185 USD/kWh, which is lower than both the previous LCOE of 0.2376 USD/kWh and the default scenario's 0.2562 USD/kWh. This indicates an improvement in the cost-effectiveness of the energy mix in the current grid-connected scenario, likely due to the lower marginal costs of drawing power from the grid as opposed to relying solely on local generation and storage.
Multi-Objective Optimization
---------------------------------------------
This simulation is designed to test the Multi-Objective Optimization mode, setting 3 Pareto points, showing the result with minimum emissions to compare it with the previous scenarios.
.. raw:: html
-----------------------------------------------
**Results Interpretation**
In the new scenario with Multi-Objective Optimization employing 3 Pareto points focusing on minimum emissions, there's a marked improvement in sustainability metrics. The high renewable penetration (89.82%) and significant battery utilization (44.61%) reflect an optimized balance between environmental goals and energy reliability.
The lowered generator share to 10.7% suggests a strategic reduction in carbon footprint.
Contrastingly, the default scenario's Net Present Cost (NPC) of approximately 132 kUSD and a Levelized Cost of Energy (LCOE) of 0.2562 USD/kWh indicate a less sustainable but potentially more cost-effective initial setup.
The new scenario's higher NPC (143.6 kUSD) and LCOE (0.2788 USD/kWh) may represent increased upfront costs for greater long-term sustainability and lower emissions. This shift aligns with global trends towards decarbonizing energy systems, even at a higher initial investment.
Incorporating a larger set of Pareto points in the optimization framework can provide a broader understanding of potential trade-offs between different objectives. This allows for a more comprehensive exploration of the solution space, helping stakeholders to better gauge the spectrum of available options.
With an increased number of Pareto points, the optimization process can reveal subtler nuances between cost, sustainability, and other factors, supporting a more refined approach to decision-making.
It aids in identifying potentially advantageous solutions that could be overlooked with a limited set of options, ultimately leading to a more balanced and strategic development of energy systems.
Solvers Comparison: GLPK and Gurobi
-----------------------------------------
In a default scenario over a five-year time horizon, the capabilities of two solvers, GLPK and Gurobi, are here compared.
.. raw:: html
-------------------------------------------------------------------------------------------------
The first notable distinction arises in computational efficiency. Using the General Linear Programming Kit (GLPK), the model run was completed in 3748.0 seconds, translating to approximately 62.5 minutes. Contrastingly, the Gurobi optimizer showcased its superior processing capability by completing the run in a mere 48.0 seconds, which is less than a minute.
This stark difference in computational time frames underlines Gurobi's advanced algorithmic approaches and computational power.
Despite the significant variance in computation time, the output metrics related to the system's configuration—comprising Solar PV capacity, battery bank size, and Diesel Genset capacity—remain consistent across both solvers, demonstrating the robustness of the model itself.
The economic implications, denoted by the Net Present Cost (NPC), total actualized Investment Cost, Operation Cost, and Levelized Cost of Electricity (LCOE), are comparable with marginal differences. This indicates that both solvers are capable of arriving at similar economic assessments for the given model parameters.
.. TODO
.. MILP Formulation with Partial Load Effect and Variable Fuel Cost
.. ---------------------------------------------
.. This iteration of the model employs a Mixed-Integer Linear Programming (MILP) framework, strategically designed to simulate a decade-long operation of mini-grids with two intervals of capacity expansion. The MILP paradigm introduces binary decision variables to address unit commitment issues, allowing for a precise representation of start-up and shut-down activities of power generation units.
.. This inclusion significantly elevates the computational complexity due to the combinatorial nature of decision variables, which exponentially increases the solution space.
.. Consequently, the simulation quantifies the trade-offs between generation costs and reliability over the course of 10 years.
.. In this iteration, the model integrates a Mixed-Integer Linear Programming (MILP) framework, adeptly designed to simulate the operation of mini-grids over a ten-year horizon with variable fuel costs, increasing annually by 10%.
.. This model includes binary decision variables for unit commitment, accurately depicting start-up and shut-down of power generation units, thereby considerably expanding the computational complexity due to the combinatorial explosion of the decision space.
.. **Results Interpretation**
.. The resultant energy mix from the simulation reveals a grid that is predominantly powered by renewable energy, with an annual renewable penetration rate averaging 83.17%. The solar photovoltaic (PV) components, though individually small in unit size, aggregate to a substantial capacity of 44.0, signifying a strategic inclination towards photovoltaic integration. The battery storage, cumulating to a capacity of 172.0, provides critical support for diurnal energy balancing, effectively mitigating the variability inherent in renewable generation. In contrast, the diesel generator’s role is minimized to a single 25 kW unit, reflecting the model’s preference for renewable over fossil-based generation.
.. The incorporation of the partial load effect in the MILP formulation offers a refined depiction of generator performance, capturing the operational nuances of suboptimal loading conditions. This factor increases the fidelity of the simulation by accounting for the variable efficiency and fuel consumption rates that characterize real-world generator usage. Concurrently, the model integrates a variable fuel cost mechanism that simulates an annual 10% escalation in diesel price, serving as an economic deterrent to the reliance on fossil-fuel-based generation. This progressive cost increment steers operational strategy towards a greater reliance on renewable assets and energy storage solutions, a shift that is both economically and environmentally strategic.
.. The fiscal parameters of the system are encapsulated by a Net Present Cost (NPC) of 107.09 kUSD and a Levelized Cost of Energy (LCOE) of 0.2892 USD/kWh. These metrics not only quantify the economic viability of the mini-grid system but also underscore the cost-effectiveness of a renewable-driven energy paradigm when projected over a significant temporal span.


.png?raw=true)
.png?raw=true)